AUD/USD Forecast: Failure at 200-Day SMA Warns of Further Losses
AUSTRALIAN DOLLAR TALKING POINTS
AUD/USD extends the decline from the monthly high (0.6939) following the Reserve Bank of Australia (RBA) Minutes, and the failed attempt to close above the 200-Day SMA (0.6906) warns of further losses amid the historical tendency around the moving average.
AUD/USD FORECAST: FAILURE AT 200-DAY SMA WARNS OF FURTHER LOSSES
AUD/USD continues to give back the advance from the monthly low (0.6762) as the RBA Minutes highlight a dovish forward guidance and states that the central bank has “the ability to provide further stimulus to the economy, if required.”
The remarks suggest the RBA is merely taking a break from its rate easing cycle as officials “continue to assess the evidence of how the easing in monetary policy was affecting the economy.” In turn, Governor Philip Lowe and Co. may continue to insulate the economy in 2020 as “weak growth in household income continued to present a downside risk to consumer spending.”
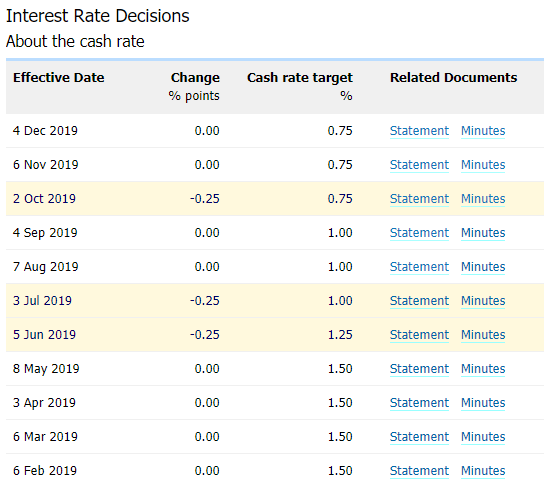
It remains to be seen if the US and China trade deal will encourage the RBA to alter the forward guidance as the central bank plans to “reassess the economic outlook in February 2020,” but the central bank may stick to the same script at the next meeting on February 4 as the Trump administration“will be maintaining 25 percent tariffs on approximately $250 billion of Chinese imports, along with 7.5 percent tariffs on approximately $120 billion of Chinese imports.”
In response, the International Monetary Fund (IMF) warns that “Australia is especially exposed to a deeper-than-expected downturn in China,” with the group going onto say that “unconventional monetary policy measures such as quantitative easing may become necessary” amid the weakening outlook for global growth.
With that said, the RBA may continue to push monetary policy into uncharted territory, and the recent appreciation in AUD/USD may continue to unravel ahead of 2020 amid the string of failed attempts to close above the 200-Day SMA (0.6906).
AUD/USD RATE DAILY CHART
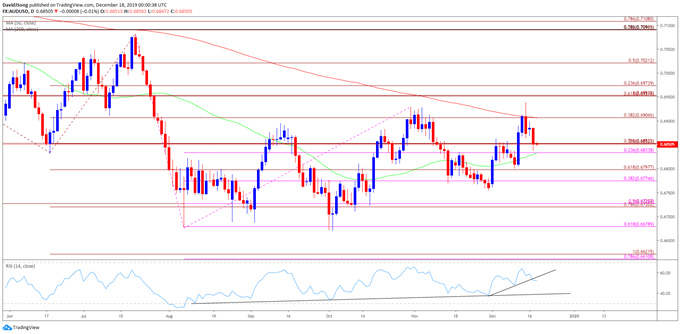
- Keep in mind, the AUD/USD rebound following the currency market flash-crash has been capped by the 200-Day SMA (0.6906), with the exchange rate marking another failed attempt to break/close above the moving average in July.
- A similar scenario appears to be taking shape in December as the advance from the monthly low (0.6762) fails to produce a closing price above the simple moving average.
- The Relative Strength Index (RSI) highlights a similar dynamic as the oscillator snaps the bullish formation from earlier this month.
- The failed run at the Fibonacci overlap around 0.6950 (61.8% expansion) to 0.6970 (23.6% expansion) has pushed AUD/USD back below the 0.6910 (38.2% expansion) region, with exchange rate currently sitting at overlap around 0.6830 (23.6% expansion) to 0.6850 (78.6% expansion).
- Need a break/close below the 0.6780 (38.2% expansion) to 0.6800 (61.8% expansion) region to bring the downside targets back on the radar, with the first hurdle coming in around 0.6720 (78.6% expansion) to 0.6730 (50% expansion).
JOIN NOW WORLD NUMBER 1 FOREX BROKER 2019-2020


Comments
Post a Comment