Gold Price Clears November High as RSI Sits in Overbought Territory
GOLD PRICE TALKING POINTS
The price of gold clears the November high ($1516) even though the US and China look to sign a trade deal over the coming day, and recent developments in the Relative Strength Index (RSI) instill a bullish outlook for bullion as the oscillator sits in overbought territory.
GOLD PRICE CLEARS NOVEMBER HIGH AS RSI SITS IN OVERBOUGHT TERRITORY
The price of gold climbs to a fresh monthly high ($1520) despite the commitment to the Phase One trade deal, and it remains to be seen if more progress will be made as the Trump administration remains reluctant to rollback tariffs.
During a recent call between President Xi Jinping and President Donald Trump, it was emphasized that “all parties should meet each other halfway, and maintain dialogue and momentum for the relaxation of the situation,” but it seems as though the Trump administration will continue to rely on tariffs and sanctions to achieve its agenda as the Office of the United States Trade Representative (USTR) initiates “a process to assess increasing the tariff rates and subjecting additional EU products to the tariffs.”
The threat of a US-EU trade war may become a greater concern in 2020 as the Trump administration argues that “France’s Digital Services Tax is unreasonable or discriminatory and burdens or restricts US commerce,” and the weakening outlook for global growth may push market participants to hedge against fiat currencies as it puts pressure on major central banks to provide additional monetary support.
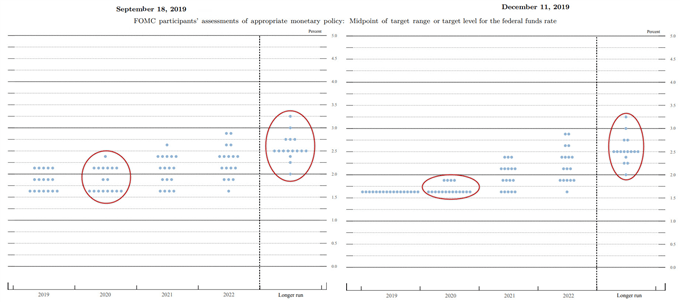
In turn, the Federal Reserve may revisit its rate easing cycle as the central bank pledges to “respond accordingly” to the economic outlook, and Chairman Jerome Powell and Co. may project a lower trajectory for the benchmark interest rate when the central bank updates the Summary of Economic Projections (SEP) in Marchas St. Louis Fed President James Bullard, a 2019 voting member on the Federal Open Market Committee (FOMC), warns that the board will “have to consider additional insurance in the meetings ahead.”
However, the FOMC appears to be on track to retain the current policy at the next interest rate decision on January 29 as the central bank insist that the “economic outlook remains a favorable one despite global developments and ongoing risks.”
With that said, Fed officials may change their tune over the coming months, and speculation for lower interest rates along with the weakening outlook for global growth may keep gold prices afloat as market participants look for an alternative to fiat-currencies.
Moreover, the reaction to the former-resistance zone around $1447 (38.2% expansion) to $1457 (100% expansion) helps to rule out the threat of a Head-and-Shoulders formation as the region appears to be acting as support.
GOLD PRICE DAILY CHART
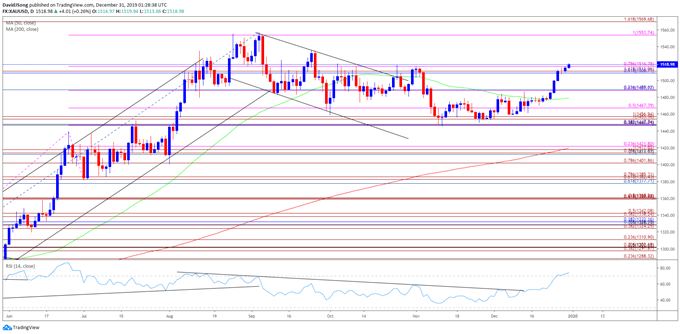
- Keep in mind, the broader outlook for gold prices remain constructive as both price and the Relative Strength Index (RSI) clear the bearish trends from earlier this year, with the precious metal trading to a fresh yearly-high ($1557) in September.
- At the same time, the reaction to the Fibonacci overlap around $1447 (38.2% expansion) to $1457 (100% expansion) helps to rule out the threat of a Head-and-Shoulders formation as the former-resistance zone appears to be acting as support.
- Recent developments in the RSI indicate a potential change in market behavior as the oscillator breaks out of the bearish formation from earlier this year and pushes into overbought territory.
- Need a close above the $1509 (61.8% retracement) to $1517 (78.6% expansion) region to bring the topside targets on the radar, with the first hurdle coming in around $1554 (100% expansion), which largely lines up with the yearly-high ($1557).
JOIN NOW WORLD NUMBER 1 FOREX BROKER 2019-2020


Comments
Post a Comment