Gold Price Continues to Test for Support Ahead of FOMC Meeting
GOLD PRICE TALKING POINTS
The price of gold gives back the advance from the start of the month as the US Non-Farm Payrolls (NFP) report boosts risk sentiment, and the Federal Reserve interest rate decision may spur a similar reaction as the central bank is widely expected to retain the current policy its last meeting for 2019.
GOLD PRICE CONTINUES TO TEST FOR SUPPORT AHEAD OF FOMC MEETING
Developments coming out of the US may continue to sway the price of gold as the Federal Open Market Committee (FOMC) is widely expected to keep the benchmark interest rate in its current threshold of 1.50% to 1.75% ahead of 2020.
Recent remarks from the FOMC suggest the committee will move to the sidelines after delivering three consecutive rate cuts as Chairman Jerome Powell and Co. see “the current stance of monetary policy as likely to remain appropriate as long as incoming information about the economy remains broadly consistent with our outlook of moderate economic growth.”
In turn, the FOMC may tame speculation for lower interest rates and endorse a wait-and-see approach for the foreseeable future as may participants judged that the “previous adjustments to monetary policy would continue to help sustain economic growth.”
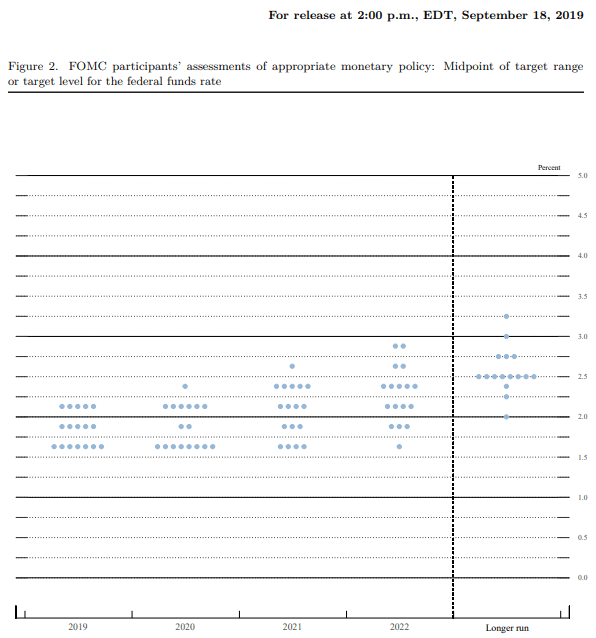
However, Fed officials maycontinue to respond to the shift in US trade policy and adjust the forward guidance when they update the Summary of Economic Projections (SEP) as “many participants continued to view the downside risks surrounding the economic outlook as elevated.”
As a result, another downward revision in the Fed’s interest rate dot-plot may boost the price of gold as market participants look for a hedge against fiat currencies.
At the same time, waning hopes of a US-China trade deal may also heighten the appeal of gold as the Trump administration plans to increase Chinese tariffs on December 15.
With that said, developments coming out of the US may sway the price of gold, but the reaction to the former-resistance zone around $1447 (38.2% expansion) to $1457 (100% expansion) helps to rule out the threat of a Head-and-Shoulders formation as the region appears to be acting as support.
GOLD PRICE DAILY CHART
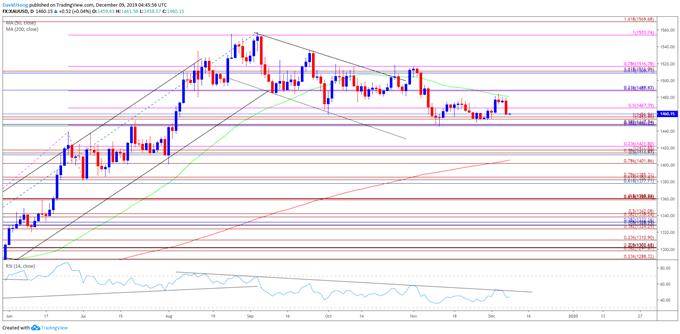
- Keep in mind, the broader outlook for gold prices remain constructive as both price and the Relative Strength Index (RSI) clear the bearish trends from earlier this year, with the precious metal trading to a fresh yearly-high ($1557) in September.
- Moreover, the reaction to the Fibonacci overlap around $1447 (38.2% expansion) to $1457 (100% expansion) helps to rule out the threat of a Head-and-Shoulders formation as the former-resistance zone appears to be acting as support.
- However, the near-term correction in the price for gold has been accompanied by a bearish formation in the RSI, with the pattern offering a mixed signal as a bull flag formation also takes shape.
- In turn, gold may largely track the November range, with a move above $1489 (23.6% retracement) bringing last month’s high ($1516) on the radar.
- Need a break/close above the $1509 (61.8% retracement) to $1517 (78.6% expansion) region to bring the topside targets on the radar, with the first hurdle coming in around $1554 (100% expansion), which largely lines up with the yearly-high ($1557).
JOIN NOW WORLD NUMBER 1 FOREX BROKER 2019-2020


Comments
Post a Comment