Gold Price Outlook - Slipping Towards Short-Term Support
GOLD PRICE ANALYSIS, CHARTS AND PRICE
- Gold may find short-term support at $1,540/oz.
- Medium- to longer-term technical should stem any further sell-off.
GOLD PRICE (XAU/USD) TRENDING LOWER
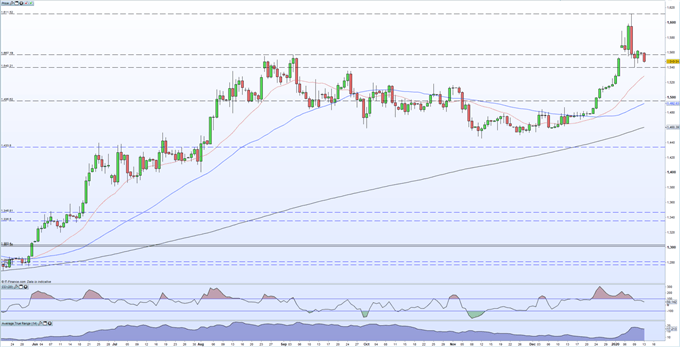
The daily gold chart shows the precious metal ebbing lower towards the January 3 low of $1,540/oz. as risk assets remain better bid ahead of this Wednesday’s signing of phase one of the US-China trade deal. Gold has fallen nearly 4% from the recent $1,611.5/oz. high print made on January 8, after the US and Iran dialed back on threats of additional military action in the Middle East and may enter a period of sideways price action as gold bulls and bears look to find equilibrium.
The longer-term chart remains positive with gold trading above all three moving averages, while the recent sell-off has seen the precious metal move out of overbought territory using the CCI indicator.
Dollar, Gold Yen: What are the Top Safe-Havens of 2020?
GOLD DAILY PRICE CHART - XAU/USD (MAY 2019 - JANUARY 13, 2020)
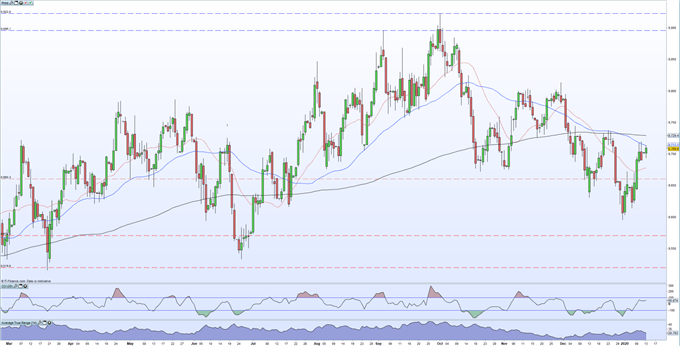
Another major driver of gold price action, the US dollar, is struggling to break above its medium-term moving average with the 50-dma capping any rally since the start od December 2019. The dollar basket chart shows an unbroken series of lower highs and lower lows off the October 1 high at 99.228, while both the 20- and 50-dmas have broken below the 200-dma, a bearish technical signal. Further slippage in the US dollar basket may well provide a supportive driver for gold.
US DOLLAR BASKET (MARCH 2019 – JANUARY 13, 2020)
JOIN NOW WORLD NUMBER 1 FOREX BROKER 2019-2020


Comments
Post a Comment