Silver, Gold Prices May Fall on Trade Deal. XPD/USD to Rise?
GOLD PRICES, SILVER PRICE CHART, PALLADIUM FORECAST, TRADE DEAL – TALKING POINTS
- Silver, gold prices may decline if trade deal cools Fed easing expectations
- Demand for anti-fiat hedges like XAU and XAG may then subsequently fall
- Palladium prices could rise on expectations of stronger Chinese demand
Silver and gold prices may fall if the rhetoric from US and Chinese officials cools 2020 Fed easing expectations along with demand for anti-fiat hedges. This comes as geopolitical tensions between Iran and the US remain relatively tepid and have also reduced market expectations of easing form the prospect war. Palladium prices may rise in anticipation of stronger Chinese growth and greater demand for it.
GOLD PRICE OUTLOOK
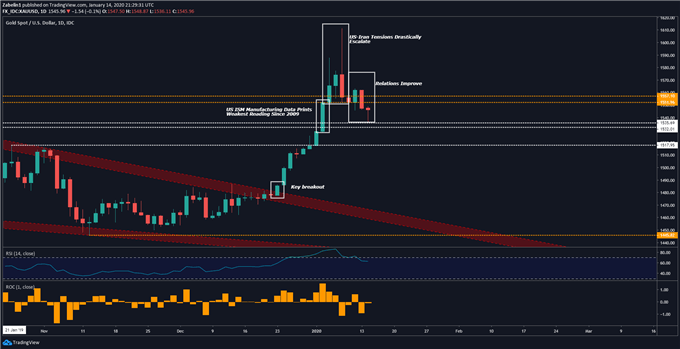
Gold prices have recently retreated following their impressive rally after the precious metal broke above the September descending resistance channel. However, it has now since retreated a little more than four percent after reaching seven-year highs. XAU/USD recently broke below the 1551.96-1557.10 resistance-turned-support range with follow-through, opening the door to testing the floor at 1535.69, with an eye at 1517.95.
XAU/USD – Daily Chart
XAU/USD chart
SILVER PRICE CHART
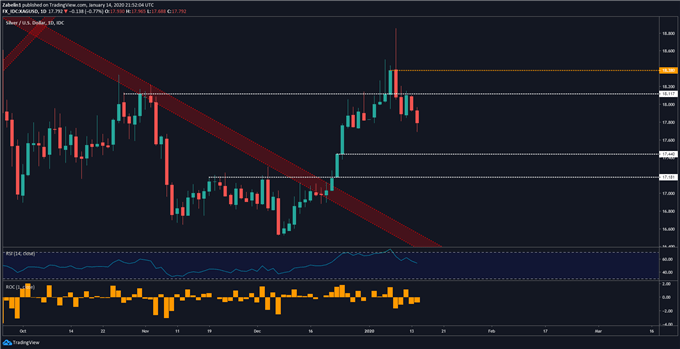
Silver prices followed a similar trajectory to gold, though it looks as if its half-way through its bearish correction as it eyes support at 17.440. Cracking this floor would open the door to testing the December 20-low at 17.181. However, if the precious metal rebounds from 17.440 with follow-through, it may speak to an underlying bullish bias and a recovery may follow.
XAG/USD – Daily Chart
XAD/USD chart
PALLADIUM SHOWING SIGNS OF TOPPING?
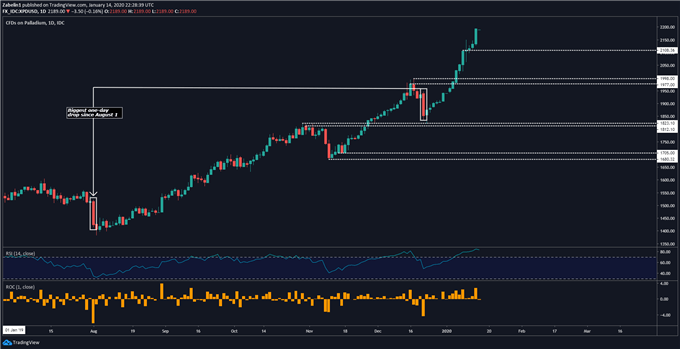
After suffering its biggest one-day dip since August 2019, palladium prices have risen almost 20 percent since December 20. The precious metal is now trading just below $2200/oz as it continues to break record-highs. Since it is in uncharted territory, it is unclear where a top might form. However, if a pullback occurs, the precious metal may look to test support at 2108.36. Cracking that could open the door to a broader decline.
XPD/USD – Daily Chart
XAD/USD
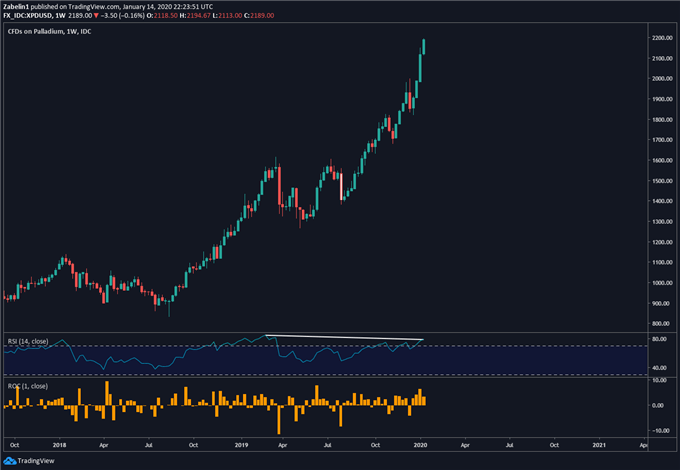
However, negative RSI divergence on a weekly chart shows that upside momentum is fading. While this does not necessarily precede a turn lower, it is a signal that warrants traders’ attention. Developments on the US-China trade war front will be crucial to monitor in light of the relationship Chinese growth has to palladium prices.
XPD/USD – Weekly Chart
XAD/USD chart
US-CHINA TRADE DEAL
US and Chinese officials are expected to sign “phase 1” of their multi-sequential trade deal as part of a broad process of de-escalation as the economic conflict continues to weaken investment and the industrial sector. Significant progress on “Phase 2” will not likely be made until after the US Presidential election, according to Donald Trump. Palladium prices may rise if the commentary from officials strike an optimistic tone.


JOIN NOW WORLD NUMBER 1 FOREX BROKER 2019-2020


Comments
Post a Comment