AUD/USD Forecast: Bear Flag Continues to Take Shape Ahead of April
AUD/USD FORECAST: BEAR FLAG CONTINUES TO TAKE SHAPE AHEAD OF APRIL
AUD/USD showed a limited reaction to Australia’s $130B JobKeeper payment program, with the exchange rate largely holding Friday’s range despite the greater-than-expected uptick in China’s Purchase Managers Index (PMI).
The range bound price action in AUD/USD may persist over the remainder of the week as Australia toughens its lockdown measure to ‘stage 3,’ and the efforts to contain COVID-19 may put pressure on the Reserve Bank of Australia (RBA) to further support the economy as Treasurer Josh Frydenberg warns “businesses will close and people will lose their jobs.”
As a result, the RBA may go beyond its yield-curve control program and implement more non-standard measures as the official cash rate (OCR) sits at its effective lower bound (ELB), but it remains to be seen if the unconventional tools will have the intended impact as the central bank pushes monetary policy into uncharted territory.
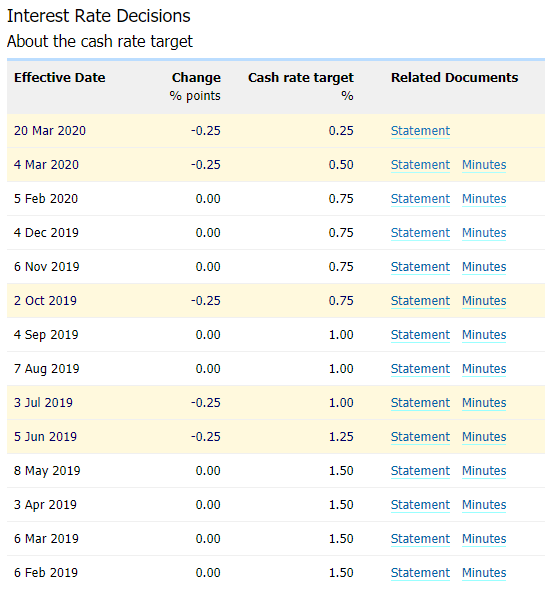
In turn, the RBA may stick to the current policy at its next meeting on May 5as Governor Philip Lowe and Co. pledge to purchase Australian government bonds for “as long as market conditions warrant,” and the central bank may merely attempt to buy time as the fiscal stimulus package reaches a combined A$320B.
With that said, the response by Australian authorities may continue to shore up AUD/USD amid the unprecedented steps to combat the weakening outlook for growth, but the rebound from the yearly low (0.5506) may start to unravel over the coming days as a bear flag takes shape.
AUD/USD RATE DAILY CHART
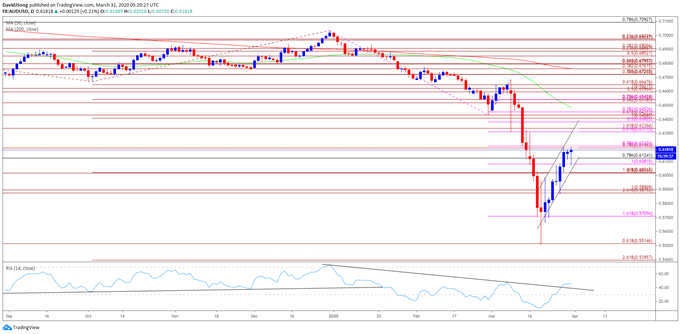
- Keep in mind, the monthly opening range has been a key dynamic for AUD/USD in the fourth quarter of 2019 as the exchange rate carved a major low on October 2, with the high for November occurring during the first full week of the month, while the low for December materialized on the first day of the month.
- The opening range for 2020 showed a similar scenario as AUD/USD marked the high of the month on January 2, with the exchange rate carving the February high during the first week of the month.
- However, the opening range for March was less relevant, with the high of the month occurring on the 9th, the same day as the flash crash.
- With that said, recent developments in the Relative Strength Index (RSI) raises the scope for a larger rebound in AUD/USD as the oscillator bounces back from bounces back from oversold territory and breaks out of the bearish formation from earlier this year, but the recent recovery in the exchange rate may end up being short lived as a bear flag formation takes shape.
- The string of failed attempts to close above the Fibonacci overlap around 0.6190 (78.6% expansion) to 0.6210 (78.6% expansion) may continue to generate range-bound prices, but a break of channel support along with a move below 0.6020 (50% expansion) may spur a move towards the 0.5880 (261.8% expansion) to 0.5900 (100% expansion) region, with the next area of interest coming in around 0.5710 (161.8% expansion).
BEST FOREX BROKER OF THE YEAR 2019/2020 XM
GET FREE $30 ,WHEN OPEN ACCOUNT


Comments
Post a Comment