Dow Jones & DAX 30 Technical Forecast for the Week Ahead
DOW JONES & DAX 30 PRICE OUTLOOKS:
- The Dow Jones has seemingly stalled out beneath resistance as it awaits fundamental catalysts
- Similarly, the DAX 30 moved off recent highs and may probe a nearby Fibonacci level
- Difference between Dow, Nasdaq, and S&P 500: Major Facts & Opportunities
DOW JONES TECHNICAL FORECAST
OUTLOOK: BEARISH
The Dow Jones moved slightly lower last week but remains comfortably above nearby support. With sentiment seemingly in the balance between bulls and bears, the Industrial Average rests between a multitude of resistance overhead and support beneath. As earnings season continues, US indices will likely take their cues from the upcoming reports and the Dow may fluctuate between the levels at hand as a result.
DOW JONES PRICE CHART: 4 – HOUR TIME FRAME (FEBRUARY – APRIL)
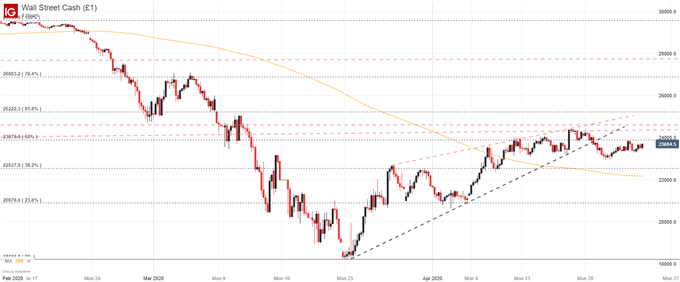
With that in mind, the DJIA may look to probe the various levels overhead starting at around 23,880 followed by two horizontal trendlines at 24,120 and 24,600 respectively if quarterly findings impress. Together, the levels overhead form a robust area of resistance that will look to keep the Dow in check, potentially allowing the Nasdaq and S&P 500 to extend their lead over the Industrial Average.
Still, market participants have shown price action is a two-way street. If bears overtake bulls in the week ahead, the Dow may find itself testing support at the 38.2% Fibonacci level around 22,537. Since the fundamental side of the market is still highly uncertain, capitalizing on attractive risk and reward set-ups between possible technical levels may be the most appropriate strategy at this stage. After failing to break above resistance over the last three weeks, price action may suggest risks are tilted to the downside.
DAX 30 TECHNICAL FORECAST
OUTLOOK: BEARISH
Like the Dow Jones, the DAX 30 has slowed its ascent in recent weeks as Fibonacci resistance looms overhead. Now, however, the German equity index has moved nearer the Fibonacci level around the 10,210 mark which may be the first area to provide support for the index. Trading between the two levels for the majority of April, it would seem the DAX has etched out a rather narrow trading range.
DAX 30 PRICE CHART: 4 – HOUR TIME FRAME (FEBRUARY – APRIL)
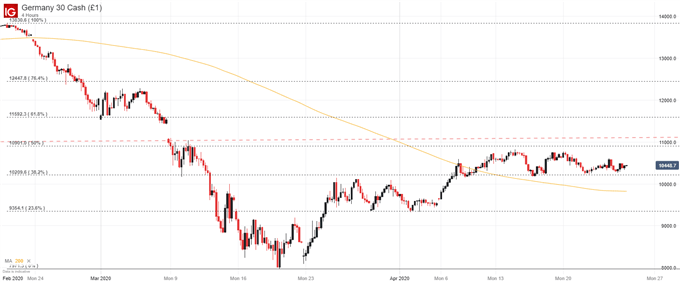
With both indices displaying an inability to surmount resistance, both appear vulnerable to losses in the week ahead. Should selling materialize, subsequent support for the DAX 30 may reside around the 23.6% retracement around 9,354. Critically, the level stands between the current spot price and the index’s March low and maintaining price above the area would be an encouraging sign for price over the longer-term, despite the weakness that would precede such a development.


OPEN ACCOUNT NOW UNDER OUR IB TO ENJOY FREE SIGNALS


Comments
Post a Comment