EUR/USD Rate Forecast: Extreme RSI Reading in Focus Going Into August
EUR/USD RATE TALKING POINTS
EUR/USD clears the September 2018 high (1.1815) following the Federal Reserve interest rate decision, and the extreme reading in the Relative Strength Index (RSI) warns of a further appreciation in the exchange rate like the behavior seen in June.
EUR/USD RATE FORECAST: EXTREME RSI READING IN FOCUS GOING INTO AUGUST
The technical outlook for EUR/USD remains constructive as the exchange rate trades to a fresh 2020 high (1.1876) going into the end of July, and current market conditions may keep the exchange rate afloat as a bull flag formation unfolds ahead of August, with the RSI helping to validate the continuation pattern as the oscillator bounced along trendline support to preserve the upward trend from March.
It seems as though the extreme RSI reading will carry into August as EUR/USD continues to retrace the decline from 2018, and the crowding behavior in the US Dollar also looks persist as the report continues to show retail traders net-long USD/CHF, USD/CAD and USD/JPY, while the crowd remains net-short NZD/USD, AUD/USD, GBP/USD and EUR/USD.
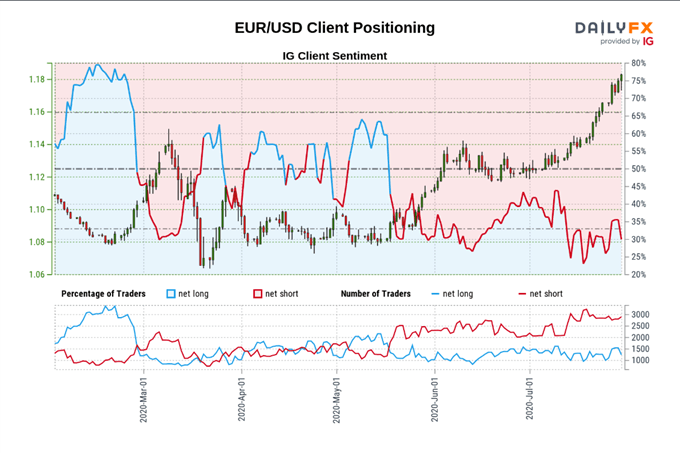
Retail traders have been net-short EUR/USD since mid-May, with the latest update showing 31.33% of tradersnet-long the pair as the ratio of traders short to long sits at 2.19 to 1.The number of traders net-long is 4.23% lower than yesterday and 10.33% higher from last week, while the number of traders net-short is 2.36% lower than yesterday and 1.50% higher from last week.
The EUR/USD rally appears to be fueling net-long interest as it clears September 2018 high (1.1815), while the recent decline in net-short positions suggests stop-loss orders are being triggered as the exchange rate trades to a fresh yearly high (1.1876).
With that said, the crowding behavior in the US Dollar looks poised even though EUR/USD trades to a fresh2020 high (1.1876), and current market conditions may keep the exchange rate afloat as long as the RSI holds above 70.
EUR/USD RATE DAILY CHART
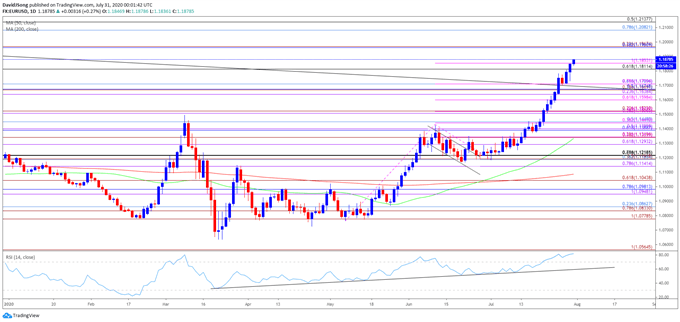
- Keep in mind, EUR/USD failed to test the March high (1.1495) in June amid the lack of momentum to break/close above the Fibonacci overlap around 1.1430 (23.6% expansion) to 1.1450 (50% retracement), with the Relative Strength Index (RSI) pulling back from overbought territory during the same period after triggering an extreme reading for the second time in 2020.
- Nevertheless, a ‘golden cross’ materialized towards the end of June as the 50-Day SMA (1.1334) crossed above the 200-Day SMA (1.1087), with the RSI bouncing along trendline support to retain the bullish trend from earlier this year.
- Will keep a close eye on the RSI as it triggers an overbought reading for the third time in 2020, with the bullish price action in EUR/USD likely to persist as long as the indicator holds above 70 amid the behavior seen in June.
- The bull flag formation panned out following the failed attempt to close below the 1.1190 (38.2% retracement) to 1.1220 (78.6% expansion) region in July, with the continuation pattern leading to a break above the September 2018 high (1.1815).
- The break/close above the Fibonacci overlap around 1.1810 (61.8% retracement) to 1.1850 (100% expansion) brings the 1.1960 (38.2% retracement) to 1.1970 (23.6% expansion) region on the radar, with the next area of interest coming in around 1.2080 (78.6% retracement) to 1.2140 (50% retracement).


Comments
Post a Comment