Gold Price Drop May Continue as Fed Stimulus Hopes Unravel
GOLD & CRUDE OIL TALKING POINTS:
- Gold prices sink as FOMC minutes cool stimulus expansion bets
- Crude oil prices pop as gasoline inventories fall most in a month
- S&P 500 futures flash red, making commodities seem vulnerable
Gold prices swooned as expected while the US Dollar rose after minutes from July’s FOMC policy meeting signaled the central bank is no hurry to expand its stimulus toolkit. Traders have speculated that the rate-setting committee may graduate to a yield curve control (YCC) regime. This would imply setting a cap on a bond yield of some target maturity and committing to defend it in the open market.
Chair Powell and company are seemingly of another mind, opting to lean on forward guidance and the promise of as-needed QE asset purchases to keep borrowing costs pinned to the floor. The markets’ response to this position suggests that the expected impact of these measures – coupled with near-zero short term interest rates – is already baked into asset prices. That bodes ill for gold’s capacity to continue trending higher.
Crude oil prices rose as EIA inventory data showed gasoline stocks unexpectedly shed 3.3 million barrels last week. That’s the largest drawdown in over a month. Investors may have interpreted the outcome as implying an on-coming pull on crude storage as refiners restock. The WTI benchmark subsequently fell with stocks as the FOMC minutes document crossed the wires, leaving prices little-changed on the day.
Looking ahead, a spirited drop in bellwether S&P 500 futures points to a downbeat mood. An expected downtick in initial US jobless claims may perversely compound the risk-off backdrop as traders reckon this may reinforce the Fed’s commitment to a wait-and-see approach. This may see gold continue lower as haven flows boost USD, dulling anti-fiat demand. Oil prices may be pressured too if shares decline.
GOLD TECHNICAL ANALYSIS
Gold prices slid back below the $2000/oz figure, with sellers seemingly poised to challenge rising trend line support set from March once again. A break below this barrier confirmed on a daily closing basis looks likely to expose a support cluster near the $1800/oz mark. Alternatively, a push above the swing high at 2015.65 probably targets the record high at 2076.58.
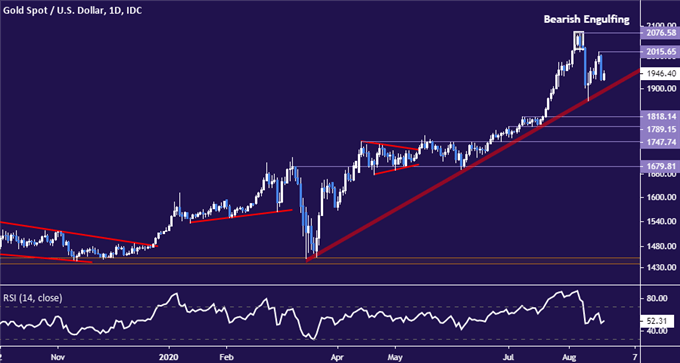
Gold price chart
CRUDE OIL TECHNICAL ANALYSIS
Crude oil prices continue to mark time at resistance in the 42.40-43.88 area. Establishing a foothold above this threshold may set the stage for a challenge of the $50/bbl figure. Alternatively, a turn below swing low support at 38.74 puts the 34.38-78 inflection zone in sellers’ crosshairs.
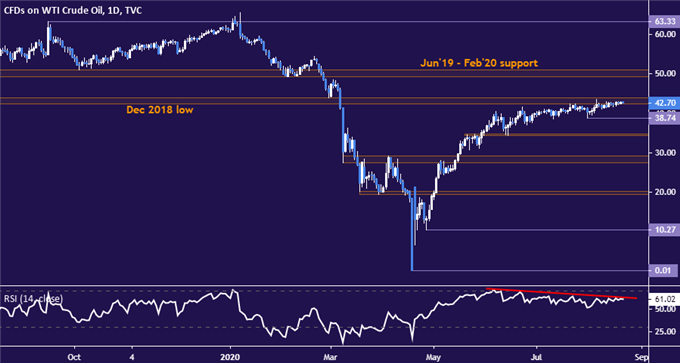
Crude oil price chart


Comments
Post a Comment