British Pound (GBP) Latest: GBP/USD Will Likely Fall Further, FTSE Up
GBP PRICE, NEWS AND ANALYSIS:
- GBP/USD dropped through trendline support Tuesday and now faces a further fall to the 200-day moving average at 1.2655. If that fails to hold, more weakness can be expected.
- The UK announced new restrictions on pub and restaurant opening times Tuesday after a surge in Covid-19 cases this month and warned that the measures could last for six months.
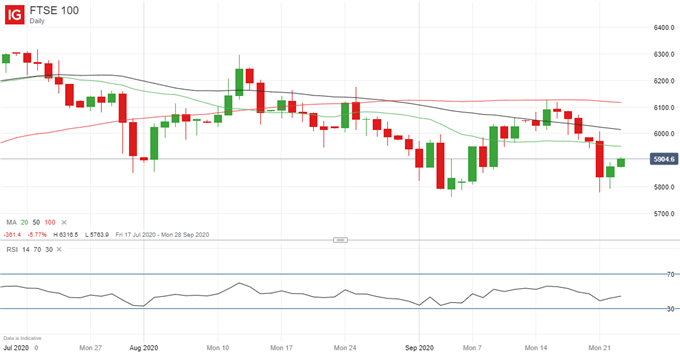
- Meanwhile the FTSE 100 is benefiting from the weakness of GBP.
GBP/USD HEADING LOWER STILL
GBP/USD continues to weaken on concerns about a lackluster economic recovery globally, spurring further risk aversion in the markets and lifting the safe-haven USD to a two-month highs as measured by the USD index.
GBP/USD PRICE CHART, DAILY TIMEFRAME (JULY 17 – SEPTEMBER 23, 2020)
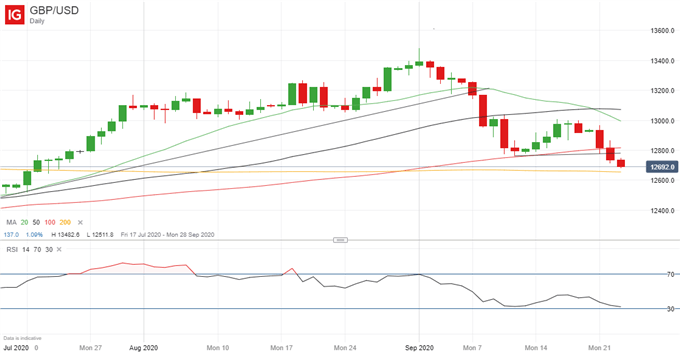
The support level that broke Tuesday was a trendline connecting the recent daily lows. Now, a drop to the 200-day moving average at 1.2655 is plausible and, if that breaks, there is little further support ahead of the mid-July lows.
Sterling traders have taken badly news of fresh curbs to avoid a second wave of Covid-19 infections in the UK, and the consequent weakness in GBP/USD has helped lift the FTSE 100 index of the largest London-listed stocks – many of which have overseas earnings and therefore benefit from a weaker Pound when those earnings are repatriated to the UK.
FTSE 100 PRICE CHART, DAILY TIMEFRAME (JULY 17 – SEPTEMBER 23, 2020)


Comments
Post a Comment