FTSE 100 Hit Hard as Fears of a New COVID-19 Lockdown Grow
FTSE 100 PRICE, CHART AND ANALYSIS:
- FTSE 100 rattled by fears of new lockdown measures.
- Bank stocks hit by fresh money laundering reports.
A fresh round of tough lockdown measures may only be days away after new COVID-19 cases and hospitalizations continue to climb, two senior scientific officers will warn today. Professor Chris Whitty and Sir Patrick Vallance will speak today at 11:00 BST and warn that the nation has reached a critical point in the pandemic and that the country will face a challenging winter period unless the UK population adhere to current government COVID-19 guidelines. According to media sources, Professor Whitty will say that the pandemic trend in the UK is going in the wrong direction and point to data from Spain and France as evidence that the fears of a second wave are real. On Friday, France announced 13,215 new cases and Spain announced 14,389 new cases.
Fears of a fresh lockdown are hitting the FTSE 100, and some of its sub-sectors hard. The FTSE 100 is currently trading around 1.5% lower at 5,881, while the more domestically orientated FTSE 250 is over 2% lower at 17,200. In the sub-indices, the FTSE 350 beverages are down 2%, while the travel and leisure sector is 3.9% lower at 6,327.
The UK bank sector is also under heavy pressure after fresh reports that several banks continued to move money around despite official warnings. One of the banks mentioned, HSBC, hit a 25-year low in Asian trade. The UK FTSE 350 bank’s index is currently quoted nearly 4% lower on the session so far.
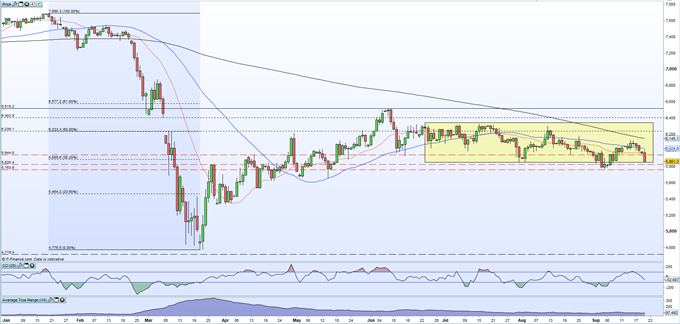
The latest sell-off is pushing the FTSE 100 back down to an old area of support which may not hold if fresh COVID-19 are announced. While the old double-low at 5,850 has been broken before, the market quickly returned into the multi-month trading range. This support is currently being re-tested and the daily chart is showing signs of renewed weakness. The index trades below all three moving-averages, while the old 38.2% Fibonacci retracement level at 5,889 is also broken. A break below the September 4 multi-month low at 5,763 would expose the 23.6% Fib at 5,464.
FTSE 100 DAILY PRICE CHART (JANUARY – SEPTEMBER 21, 2020)


Comments
Post a Comment