Gold, Silver Price Forecast: Key Supports Broken as US Dollar Strengthens
GOLD & SILVER PRICE OUTLOOK:
- Gold prices consolidate at US$ 1,900 after breaking a key support at US$ 1,910
- Silver prices fell for a third day with downward momentum prevailing
- A rising US Dollar may continue to exert pressure on precious metal prices
Gold prices fell sharply this week, as the US Dollar climbed to its highest level seen in over 7 weeks. Resurging coronavirus concerns and dwindling US fiscal stimulus hopes put traders on a defensive mode, spooking a new round of profit-taking activities. A rising US Dollar may continue to be an inhibiting factor on precious metal prices.
From a long-term perspective, gold prices may have entered into a period of consolidation within a mega bull trend. Gold prices have retraced 8.5% from its all-time-high seen in early August, after rising more than 40% from their March lows. The macro-environment (ultra-low interest rates and QE) remains accommodative to precious metal prices, albeit a short-term pullback is underway.
Technically, gold prices dived below its 50-Day Simple Moving Average (SMA) this week. It has also broken a key support level at US$ 1,910, which is the 61.8% Fibonacci retracement (chart below). The momentum appears biased towards the downside, with the next key support level likely found at US$ 1,874 – the 76.4% Fibonacci retracement.
Gold Price – Daily Chart
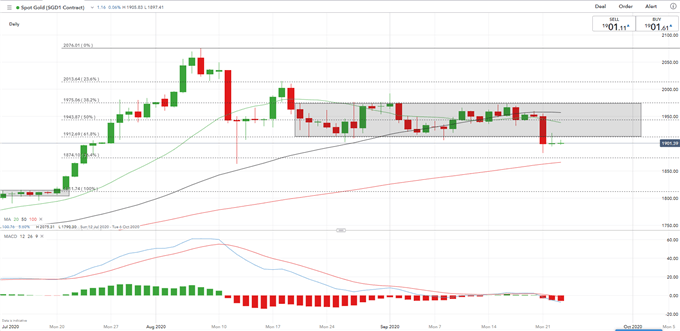
Gold traders are heavily leaning towards the long side, with 80% of the positions net long, while 20% are net short. As gold prices fell, traders added more short positions (+19%) overnight. Compared to a week ago, however, traders have trimmed some short (-4%) bets while adding marginal long (+1%) positions.
SILVER PRICE OUTLOOK:
Silver prices fell a third day, forming a “Death Cross” in its daily chart (circled below) as the 20-Day SMA crossed below the 50-Day SMA. The near-term momentum appears biased towards the downside, with an immediate support level found at US$ 23.3 – the 61.8% Fibonacci retracement.
Although silver prices have retraced 24% from recent peak (US$ 29.8), it still appears to be a reasonable pullback after gaining more than 160% from the March low.
Silver Price – Daily Chart
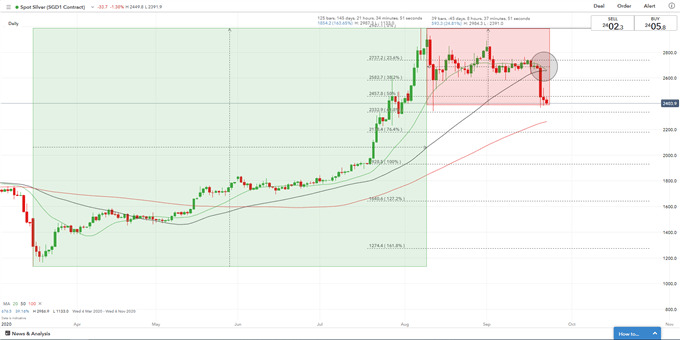
Traders are heavily leaning towards the long side, with 88% of positions net long, while 12% are net short. As silver prices fell, traders geared up short positions (+23%) overnight while trimming long positions slightly (-3%). Compared to a week ago, however, traders have reduced both long (-4%) and short (-6%) positions.


Comments
Post a Comment