Gold, Silver Price Forecast: Will 100-Day SMA Hold or Break?
GOLD & SILVER PRICE OUTLOOK:
- Gold prices consolidate at US$ 1,860 after breaking a key support at US$ 1,910
- Silver prices are testing the 100-Day SMA at 22.80, with momentum biased to the downside
- The US Dollar retraces slightly from a two-month high, but may rise again on election and Brexit risks
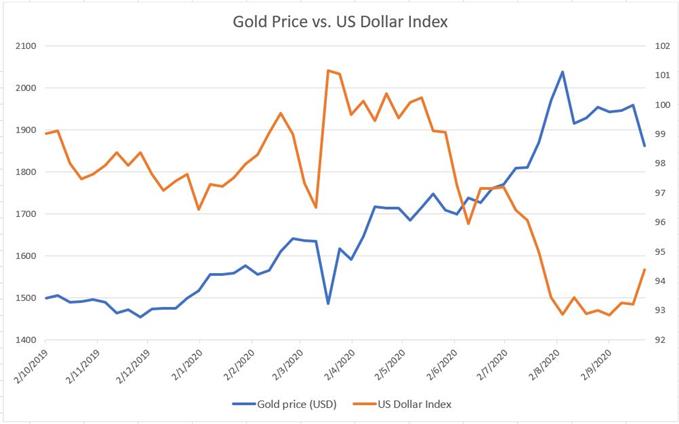
Gold and silver prices consolidated for a third consecutive week as traders kicked off profit-taking following a massive bull rally seen from March to August. Unwinding activities are also based on a tepid inflation outlook as job growth appears to have slowed recently and a second viral wave has likely emerged in Europe. A stronger US Dollar also weighed on precious metal prices. A clear negative correlation between gold and the US Dollar Index (DXY) was observed in the past 52 weeks (chart below)
Gold has retraced over 10% from its all-time high of US$ 2,075 observed on the 7th August 2020, after rising more than 40% from March low. Similarly, silver has fallen over 27% from its recent peak of US$ 29.40, after rallying over 150% from March through to August.
The near-term outlook for gold largely depends on the US Dollar, which is facing a string of market events this week. The final round of Brexit talks on Monday in Brussels, the first US presidential election debate on Tuesday and US non-farm payroll data on Friday will be critical for the US Dollar.
Gold Price vs. US Dollar Index – 52 weeks
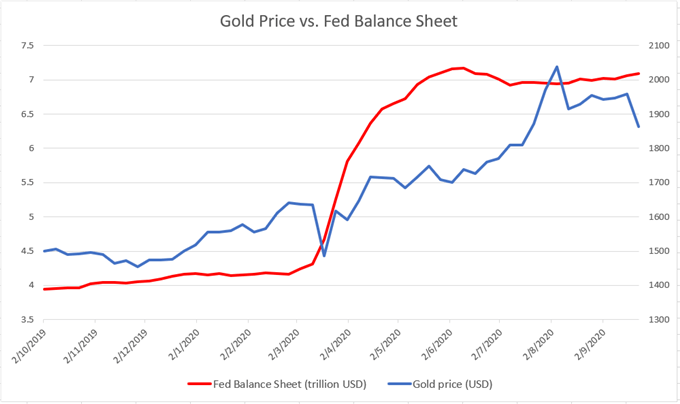
From a long-term perspective, however, gold prices appeared to have entered a period of consolidation within a mega bull trend. The macro-environment (ultra-low interest rates and QE) remains accommodative to precious metal prices, albeit a short-term pullback is underway.
Gold Price vs. Fed Balance Sheet
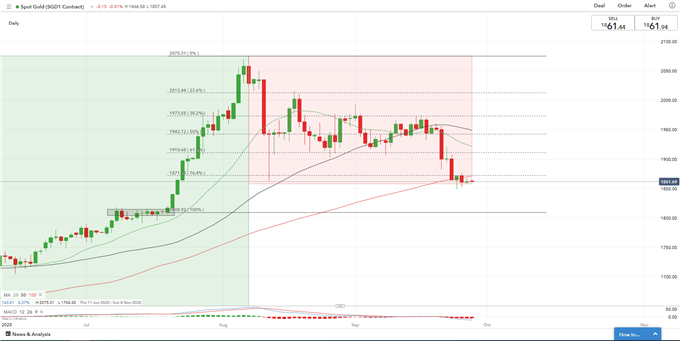
Technically, gold prices are consolidating at the 100-day SMA (1,870) after breaking the 50-day line last week. The momentum appears biased towards the downside, with the next key support level likely found at US$ 1,809 – a previous resistance level.
Gold Price – Daily Chart
Sentiment indicates that gold traders are heavily leaning towards the long side, with 82% of positions net long, while 18% remain net short. As gold prices fell, traders favored short (+4%) exposure rather over long (+3%) however, compared to a week ago, traders have trimmed some short (-5%) bets while adding some long (+7%) positions.
SILVER PRICE OUTLOOK:
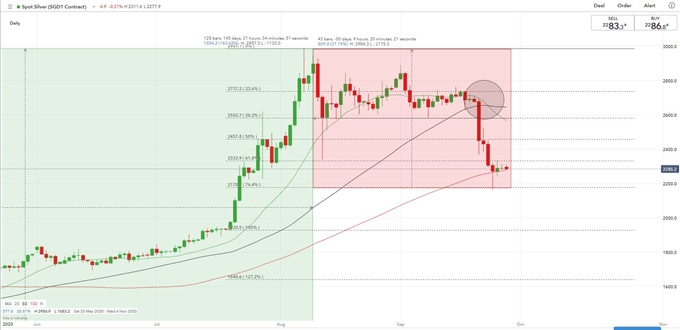
Silver prices are also testing the 100-day SMA at US$ 22.80, which is a critical support level to watch. Near-term momentum remains bearish-biased, with the next support level likely found at US$ 21.80 – the 76.4% Fibonacci retracement.
Silver Price – Daily Chart


Comments
Post a Comment